When we undertake any type of project, of whatever nature, it is more necessary than ever to be able to count on natural allies for its development, so that their contribution allows us to give relevance and pertinence to our practice.
By Miguel Jaenicke
co-creator of [VIC] Vivero de Iniciativas Ciudadanas | www.vicvivero.net | www.civics.cc
Featured in the book The Power of Ecosystems
In the case of projects with a clearly open and shared vocation, in which citizen participation takes on a central role, it is essential to know which agents we can link up with and how they are organised, so that we can mitigate, as far as possible, the dysfunctions typical of citizen participation (lack of operability, increase in times, lack of hierarchy).
Therefore, it is necessary to start any project with a broad and diverse look around us. Detect which is the ecosystem in which we are inserted, and which will be crossed by our planned action. This contextualisation is necessary to avoid the phenomena of “parachuting” – lack of connection with the territory and its inhabitants –, excessive self-absorption or solipsism. This first look seeks to find people and groups affected by – and affecting – our proposals. It is likely that we are not the first to come up with completely new ideas, or totally original approaches to the territory. It is also probable that many agents are already developing complementary, similar, pioneering or inspiring activities that can contribute to making our proposal more far-reaching and have a multiplying effect on its impact.
It is therefore a question of seeking out our existing natural allies to support us – and them – for positive transformation. The underlying thesis involves assuming that not only the so-called experts have specific knowledge of certain issues that affect an entire community and territory, but that it is that community that has specific knowledge about the issues that affect them, and how they affect them. From this distributed perspective (learning communities), we can say that all people are experts in something, from a specific point of view within their position in the value chain of an action: as decision makers, managers, operators, facilitators, beneficiaries, clients, users, victims, stakeholders… All of them, therefore, can contribute to giving greater significance to the practices being developed.
The proposed view is translated into a map that allows a holistic and attractive visualisation of each of the relevant agents in the territory (points), geolocated in a specific space (territorial framework), on specific themes (sectors) and with their internal relations (lines). Each of the initiatives, due to their own condition, are usually very much linked to the daily action “in the trenches”, so they do not have the time or capacity to carry out communication, connection and hybridisation tasks with other entities through shared tools.
The map, therefore, works like any other map we usually use, providing quality, ordered and related information on a territory. Usually maps have two main variables: the territorial framework, which determines the mapped content within a previously defined space, and/or the sectorial framework, which circumscribes the information contained to a certain pre-selected topic or sector. In this way we can combine both variables to map: our project will have specific attributes based on the space it is in and the main issues it raises, and therefore that space and that sector will be the ones of interest for the mapping.
In order to construct this map as a working tool we must therefore gradually incorporate those agents and communities existing in the territory which have a direct or potential relationship with the project we are developing. This incorporation is nothing more than positioning the relevant known agents in the selected territorial framework, and providing these points with a colour code, or icon, which allows us to discern their areas and work spaces, their sectors of activity or the type of agent supporting these actions. This activity is very simple if this knowledge is given directly and clearly, and therefore the translation of these data to the map is simply procedural.
But in most cases this information is far from clear and accessible. We may find ourselves in a situation where we have to map a territory that we do not know previously, and therefore need access to this knowledge in order to be able to construct the map. To do this, it is necessary to carry out exhaustive field work that allows us to detect which relevant agents exist, or to link up with key agents that are capable of quickly connecting us with communities. Even in our own cities, it is often very difficult for us to access this knowledge, which gives rise to the paradox of “not knowing what your neighbour is doing”, when that same neighbour can be an asset of value to our practice.
And this is because much of this knowledge is tacit, distributed among small communities of interest that do not manage to share their values. Many communication channels are not interested in such alternative or minority practices and do not offer them spaces for generalist dissemination. Also, the precariousness and precarity of these practices does not allow them to build and provide their communication and dissemination channels with powerful tools to position their groups and projects in situations of influence. There may even be an explicit refusal to link up with other organisations and entities such as administrations, universities or other more institutionalised bodies.
The existing urban maps in most cities are tourist maps, which refer to a sclerotised city, made up of architectural pieces from the past, monuments, historical and artistic sites, football fields and shopping centres. These are the tourist maps that we can request at any tourist office, train station or airport in any city in the world. But beyond these maps, which tell us about a certain type of city – visible, consumable… – there are other urban values and assets, which can be translated into alternative and complementary maps that show us living and active communities, creative and collaborative initiatives, spaces for experimentation and innovation and public administrations committed to the urban transition towards resilient, healthy cities and facing the challenges of the future.
The challenge, then, is to generate a map that contains the information that is most difficult to access, collecting those practices and communities that are most invisible, local and peripheral. To generate a complementary map which helps to understand another type of city, which allows a close connection with local communities and urban practices. A map that puts people, groups and their practices at the centre. These practices are, in turn, the most precarious, insecure and fragile, but at the same time the most innovative, courageous and transformative initiatives. Many of these initiatives face the challenges of the future and aim at the transition of our cities, as they are in niches of opportunity that will later be opened to the general public. And it is not only the contents of their daily practices that point to future trends (whats) – but also the way in which they do so, through their own values such as the recovery of sovereignty, networking, participation and collaboration, equity, transparency (hows).
The visibility of all these initiatives on maps that are open and shared with the rest of the citizens contributes to positioning these practices as first-rate urban assets, which allow communities to coproduce cities through their own collective tools, which allow citizens to be empowered through urban education, which keep the social fabric united and cohesive, and which cover gaps and social needs where administrations do not reach. They allow us to glimpse which urban areas have more initiatives, even with over-represented symbolic centres, and which urban areas lack citizen initiatives of local support. They also tell us what issues they work on and what their actions demand, generating a kind of local urban agenda that can be contrasted with public agendas and debates.
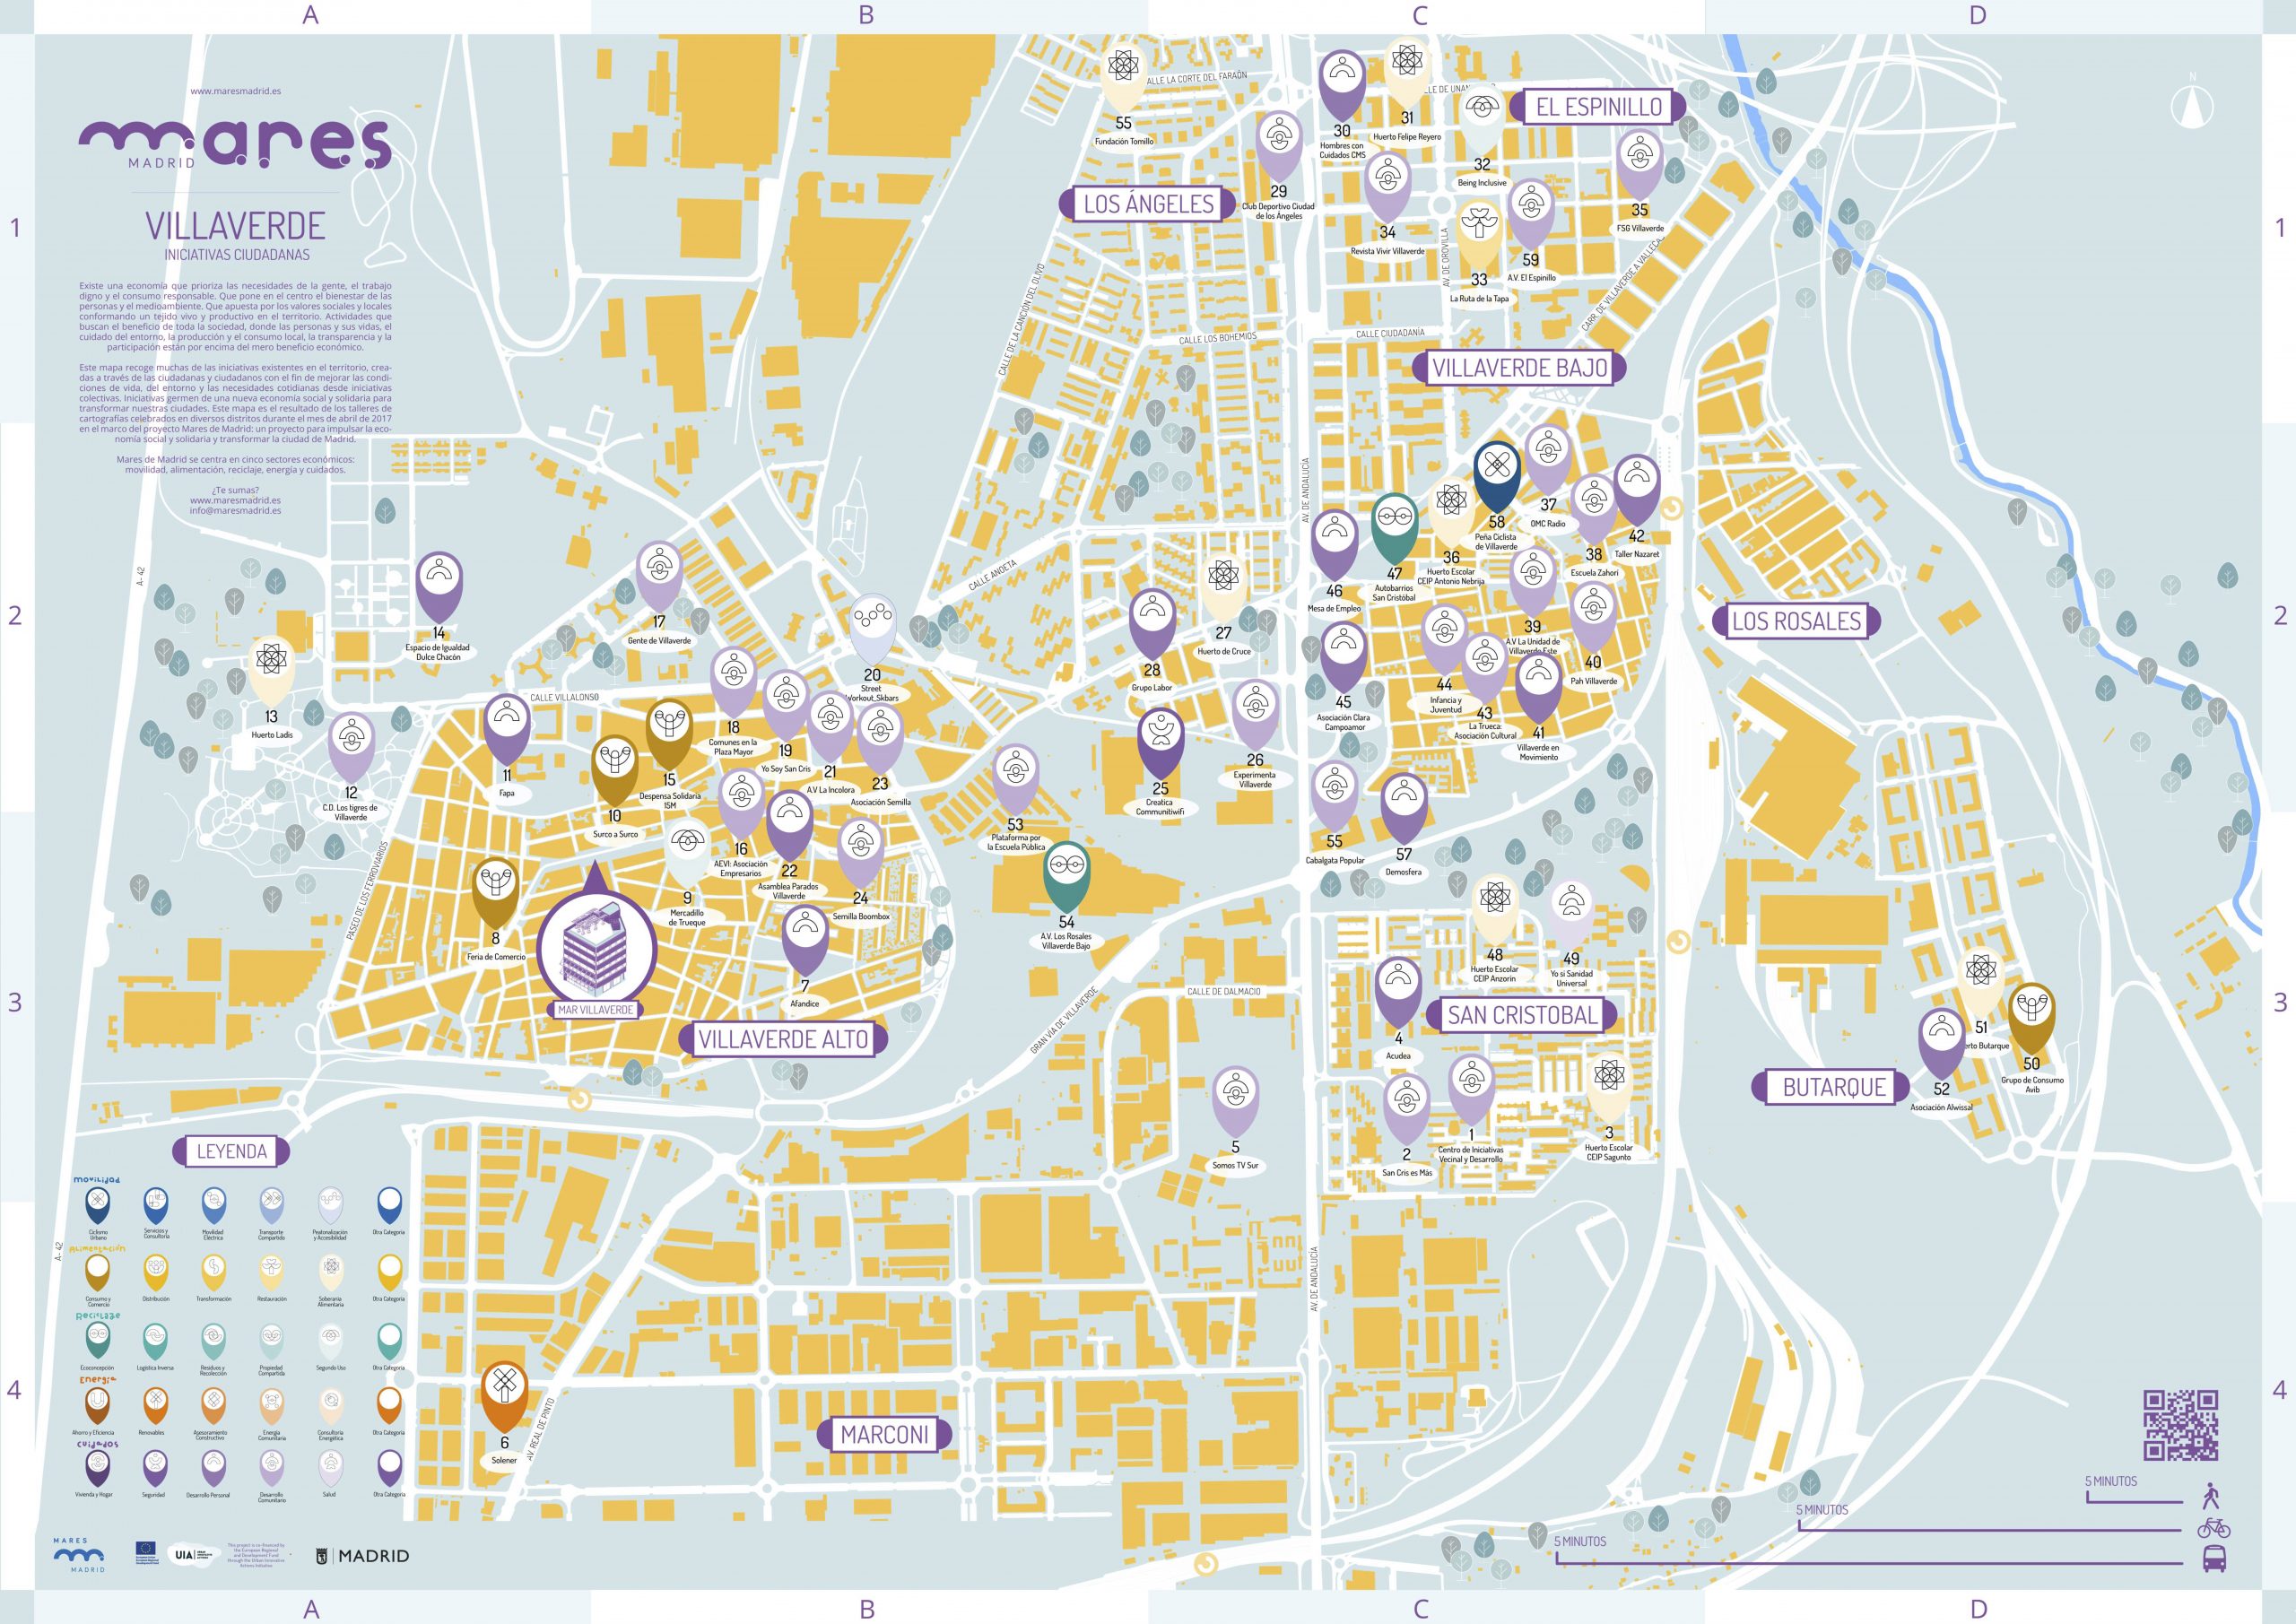
The map – and the mapping workshops –, therefore, become a tool that allows us to detect who the relevant agents of the territory are, and what needs they have – space, institutional support, funding… –, what issues they address in their daily practices, what resources, agents and models of governance they incorporate and share, and how this can become collective learning that can be replicated and scaled up to other entities and organisations. In addition, the information on communities provides information on the possible competencies and skills of these communities, their degree of maturity and their potential as a viable, sustainable and transforming business – as implemented in the MARES Madrid project funded by the European Union’s Urban Innovative Actions programme. In short, the aim is to promote greater social involvement, better cohesion of the city’s creative and productive fabric, better and greater participation by the local ecosystem and to build bridges with the administration, companies and universities for the development of new urban and social transformation projects.
The map is not just a tool or a “finished” cultural product. The map is the beginning of a process that generates new coproduction trends between the different agents through spaces, dynamics and methodologies that allow you to take advantage of windows of opportunity for new projects and proposals. The map allows for the generation of a database of relevant agents for the communication of activities, programmes, calls, workshops…it allows for visits, exchanges and residences between similar or complementary initiatives…it allows for the construction of alliances, partnerships and consortiums…it allows for the prototyping of solutions through citizen laboratories or experimental spaces…it allows for the transformation and implementation of public policies through their knowledge and learning.
The creation of an innovative ecosystem inevitably involves a map of resources and communities in the emerging and informal city. A social innovation map of the city. And this has been understood by countless initiatives and local groups, that have mapped their territories by situating inspiring and innovative experiences, making visible a layer of information that was previously tacit and inbred. And in the same way this was a need that began in Madrid from a small group of groups that decided to offer a new image of a living, innovative and proactive city. Shifting “from protest to proposal” through the public display of cultural and social associations, neighbourhood platforms, spaces for creation and citizen participation, the reactivation of disused or abandoned public spaces, the experimentation of other economies based on social currencies, time banks, barter or chains of favours, sustainable mobility, urban agriculture and an endless number of urban practices representing alternatives to the hegemonic urban dynamics.
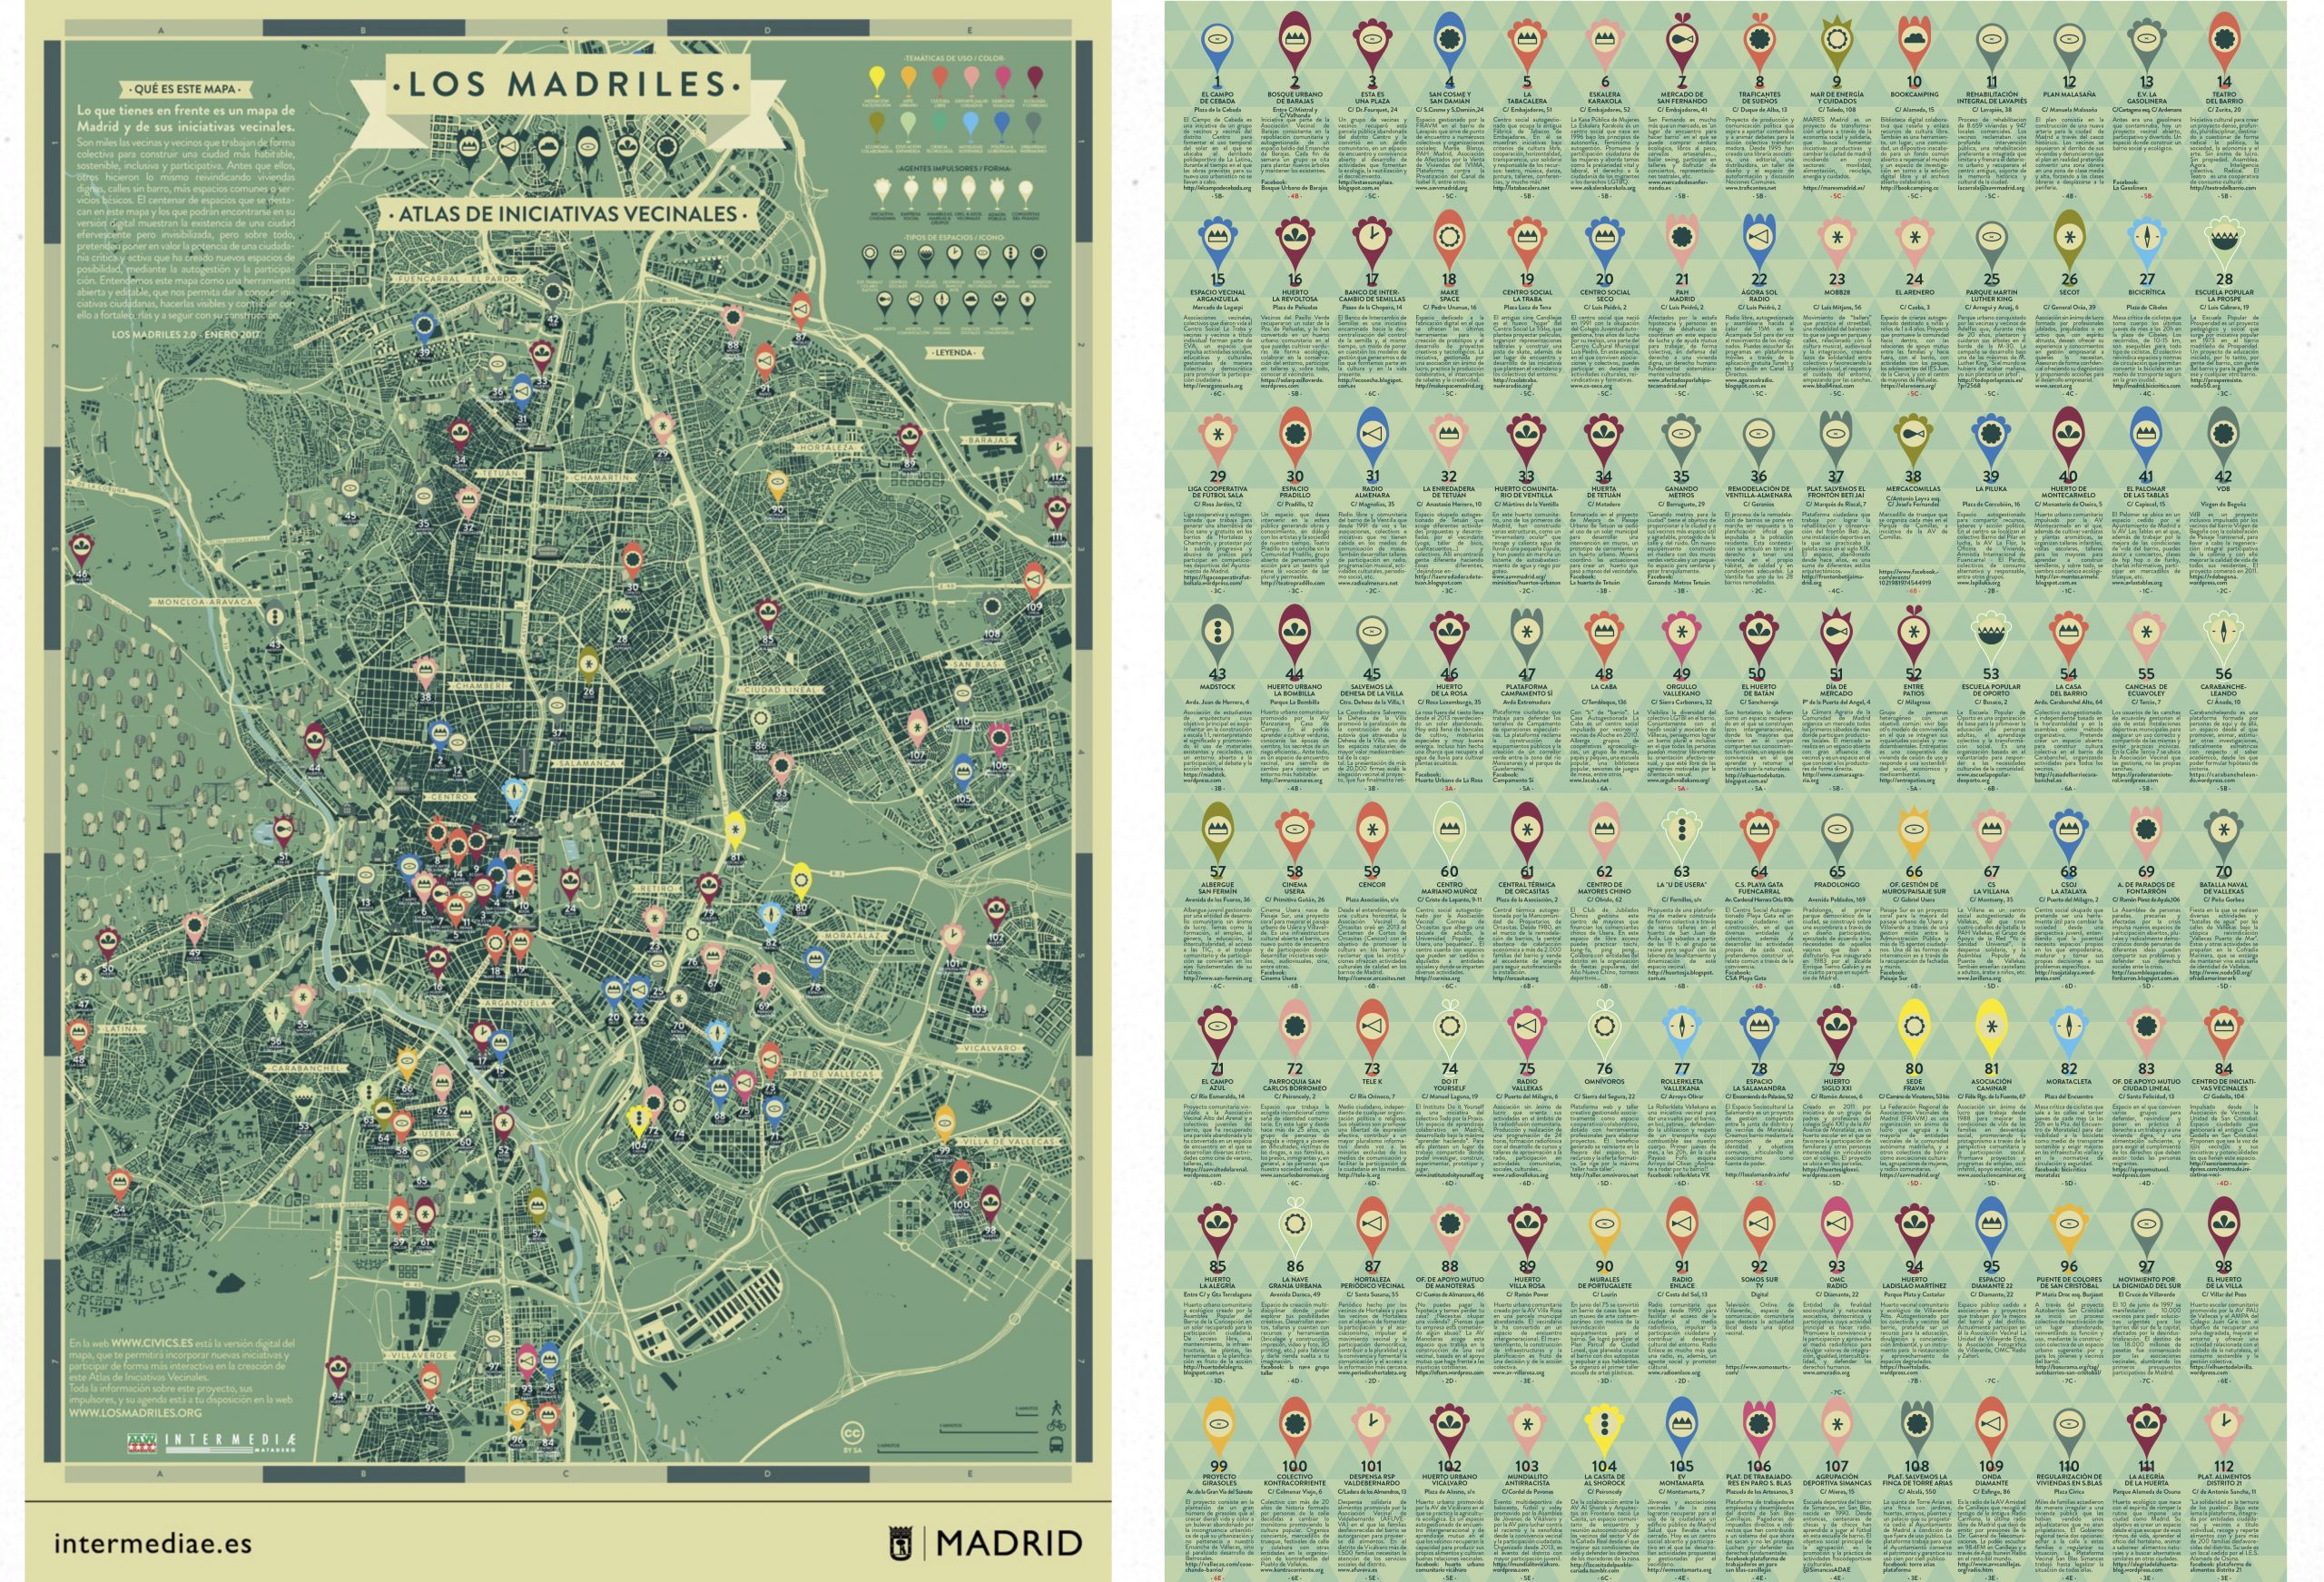
All this work gave rise to the Atlas of Neighbourhood Initiatives, which was called Los Madriles (co-led by VIC among other collectives) and resulted in a city map which was later extended to other maps which included the mapping work in different districts of the city. In addition to the districts, specific maps were made of strategic sectors and issues for the city, such as the map of Madrid’s urban gardens, the map of childhood and child-rearing spaces and the map of urban violence. All these maps were collected on a website which brought together all the maps that were generated, both with the territorial variable and with different themes, in what came to be known as an “atlas of maps“. All the maps produced were printed on paper and distributed in cultural centres and tourist offices throughout the city of Madrid, including posters at bus stops, public presentations and workshops open to the public. Institutional support was key to the dissemination of the project and the citizen-based ecosystem included in the map. As a result of the existence of the initiative many other paper maps have been designed, including cities such as Zaragoza, Valencia, Vitoria or Guadalajara in Mexico.
In parallel to the paper maps, a digital cartography was developed that could include all the initiatives detected, including all the existing themes in a global territory. The aim was to avoid the restrictions of paper maps – physical space, selection of territories and themes… – by combining all the information in a meta-map or “map of maps.” This tool made it possible to include any type of innovative initiative by classifying it through a series of filters that allowed the information to be organised in a clear and easily accessible way. The map was designed to be constructed from the initiatives themselves, seeking from the outset clear returns that could be of interest to those same communities, looking for a meaning and significance to the tool that would allow it to be nurtured from within the existing ecosystem itself based on a clear benefit and not as an external project to them.
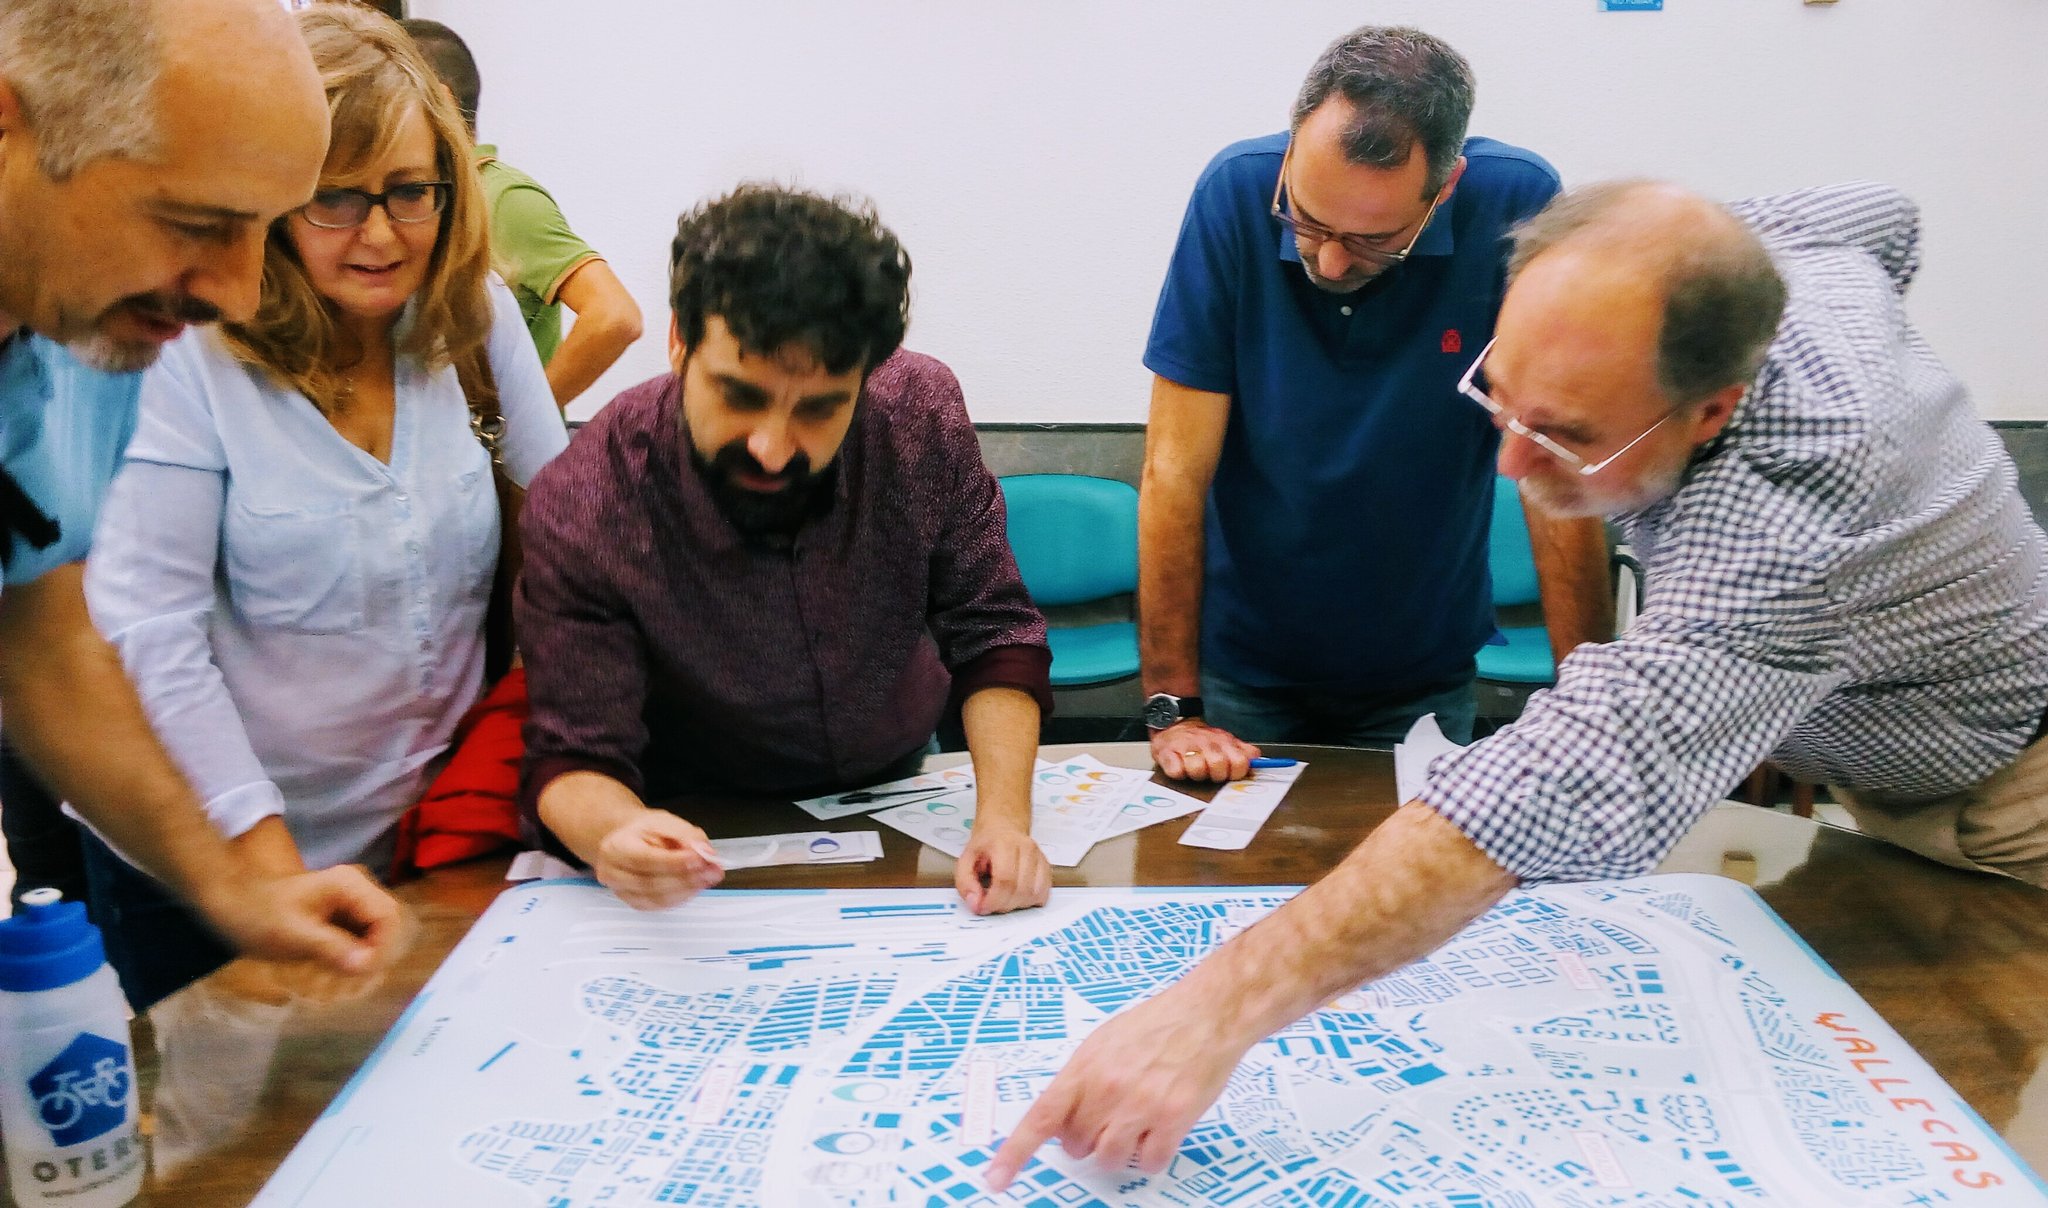
The map slowly emerged through various workshops held in different locations. In these workshops, the local community defined their practices on the basis of their own categorisations and groups of issues, as well as the type of venue in which they carried out their activities, the operator nature that could be provided or the relevant information that would be interesting to include on the map. In this way, CIVICS, the open and interactive digital cartography was born, which uses open and freely licensed tools to map, through collective intelligence, citizen initiatives of any kind of sector and subject on a global scale.
CIVICS currently has more than 5,500 registered innovative initiatives in more than 50 cities in 17 countries in the Ibero-American region. The platform is structured through a series of filters that make up the icon that appears on the map: the colour refers to the initiative theme (free culture, urban art, alternative economy, expanded education, sustainable mobility…), the inner icon is linked to the type of space in which the initiative is developed (garden, popular school, creative space, digital space, ephemeral space…) and finally the upper wig defines the type of driving agent (government, university, social enterprise, citizen initiatives….). This combination of the three variables allows us to generate three input filters for information and visualisation which, together with the selected city, allows us to access the information we are looking for very quickly.
All the information self-generated on the map is open and downloadable, as it could not be otherwise coming from the local collective intelligence. All the data used is public and no personal or sensitive data is handled, protected by legislation on the other hand. The cartographic base uses OpenStreetmap (open software) and all the programming of the page is in a Github repository so it can be customised or replicated. The way to collect the information is through collective and participative workshops in each of the cities, where, through an open call in a reference space, local initiatives are made visible through a distributed knowledge exchange space. Even initiatives which are no longer operational become part of a digital archive, or innovation repository, which can serve to inspire new proposals or fix the knowledge of ephemeral projects in other past scenarios.
The mapping methodology deployed by VIC includes a “city package” based on the selection of cities to be mapped during a week-long trip. These trips usually combine major capitals with secondary cities. Each city should have a local partner in charge of providing communication services, space facilities, logistics and local knowledge. Local partners could be state government (federal), local administrations (council), cultural areas, cultural centres, coworking spaces, grassroots communities or a combination between them. A call to join the workshop is usually promoted by the institution or cultural centre where the workshop will take place.
Mapping workshops are developed in a central or peripherical but well-connected facility. Preferably in a social/ cultural centre with a good prestige among grassroots initiatives. Around 20-30 people share their own experience, show the local initiatives, learn how to use the digital platform and attend a mapping lecture. Once the workshops are over we do collect analogic data (provided by the communities in the workshops) in order to transfer it to the digital tool CIVICs. For that purpose, analogic data has to be uploaded onto CIVICs, adding media (pictures, videos…).
Finally all the information is uploaded on CIVICs. Once the city is “completed”, the visualisation is sent to the community. They can also download the database of the local ecosystem. Prior to publishing final results to social media and other channels, workshop participants are encouraged to check all the information in order to share correct information about their activities. Moreover, if an organisation is not willing to appear on CIVICs, it is removed from the database.
In the last year, the dimension of Agenda 2030 and the Sustainable Development Goals (SDGs) has been incorporated in the maps. The thesis for this is that the SDG have been designed by and for public policies between the different levels of local, regional, national and supranational administration – where civil society has not been incorporated as a relevant agent due to its lack of capacity to measure and evaluate the impacts and indicators of the agreed goals. But civil society contributes decisively at the local level to the achievement of these SDGs, and therefore it is necessary to have instruments and tools that allow us to see the contributions that local communities make to social, economic, urban and environmental transformation. Civil society and local communities are a clear vector of transformation and therefore it is essential that their practice is linked to the SDG. The inclusion of such diverse initiatives in such distant places through a homogeneous code of filters and the SDG allow for comparative analysis and the measurement of impacts on the urban agendas of each city.
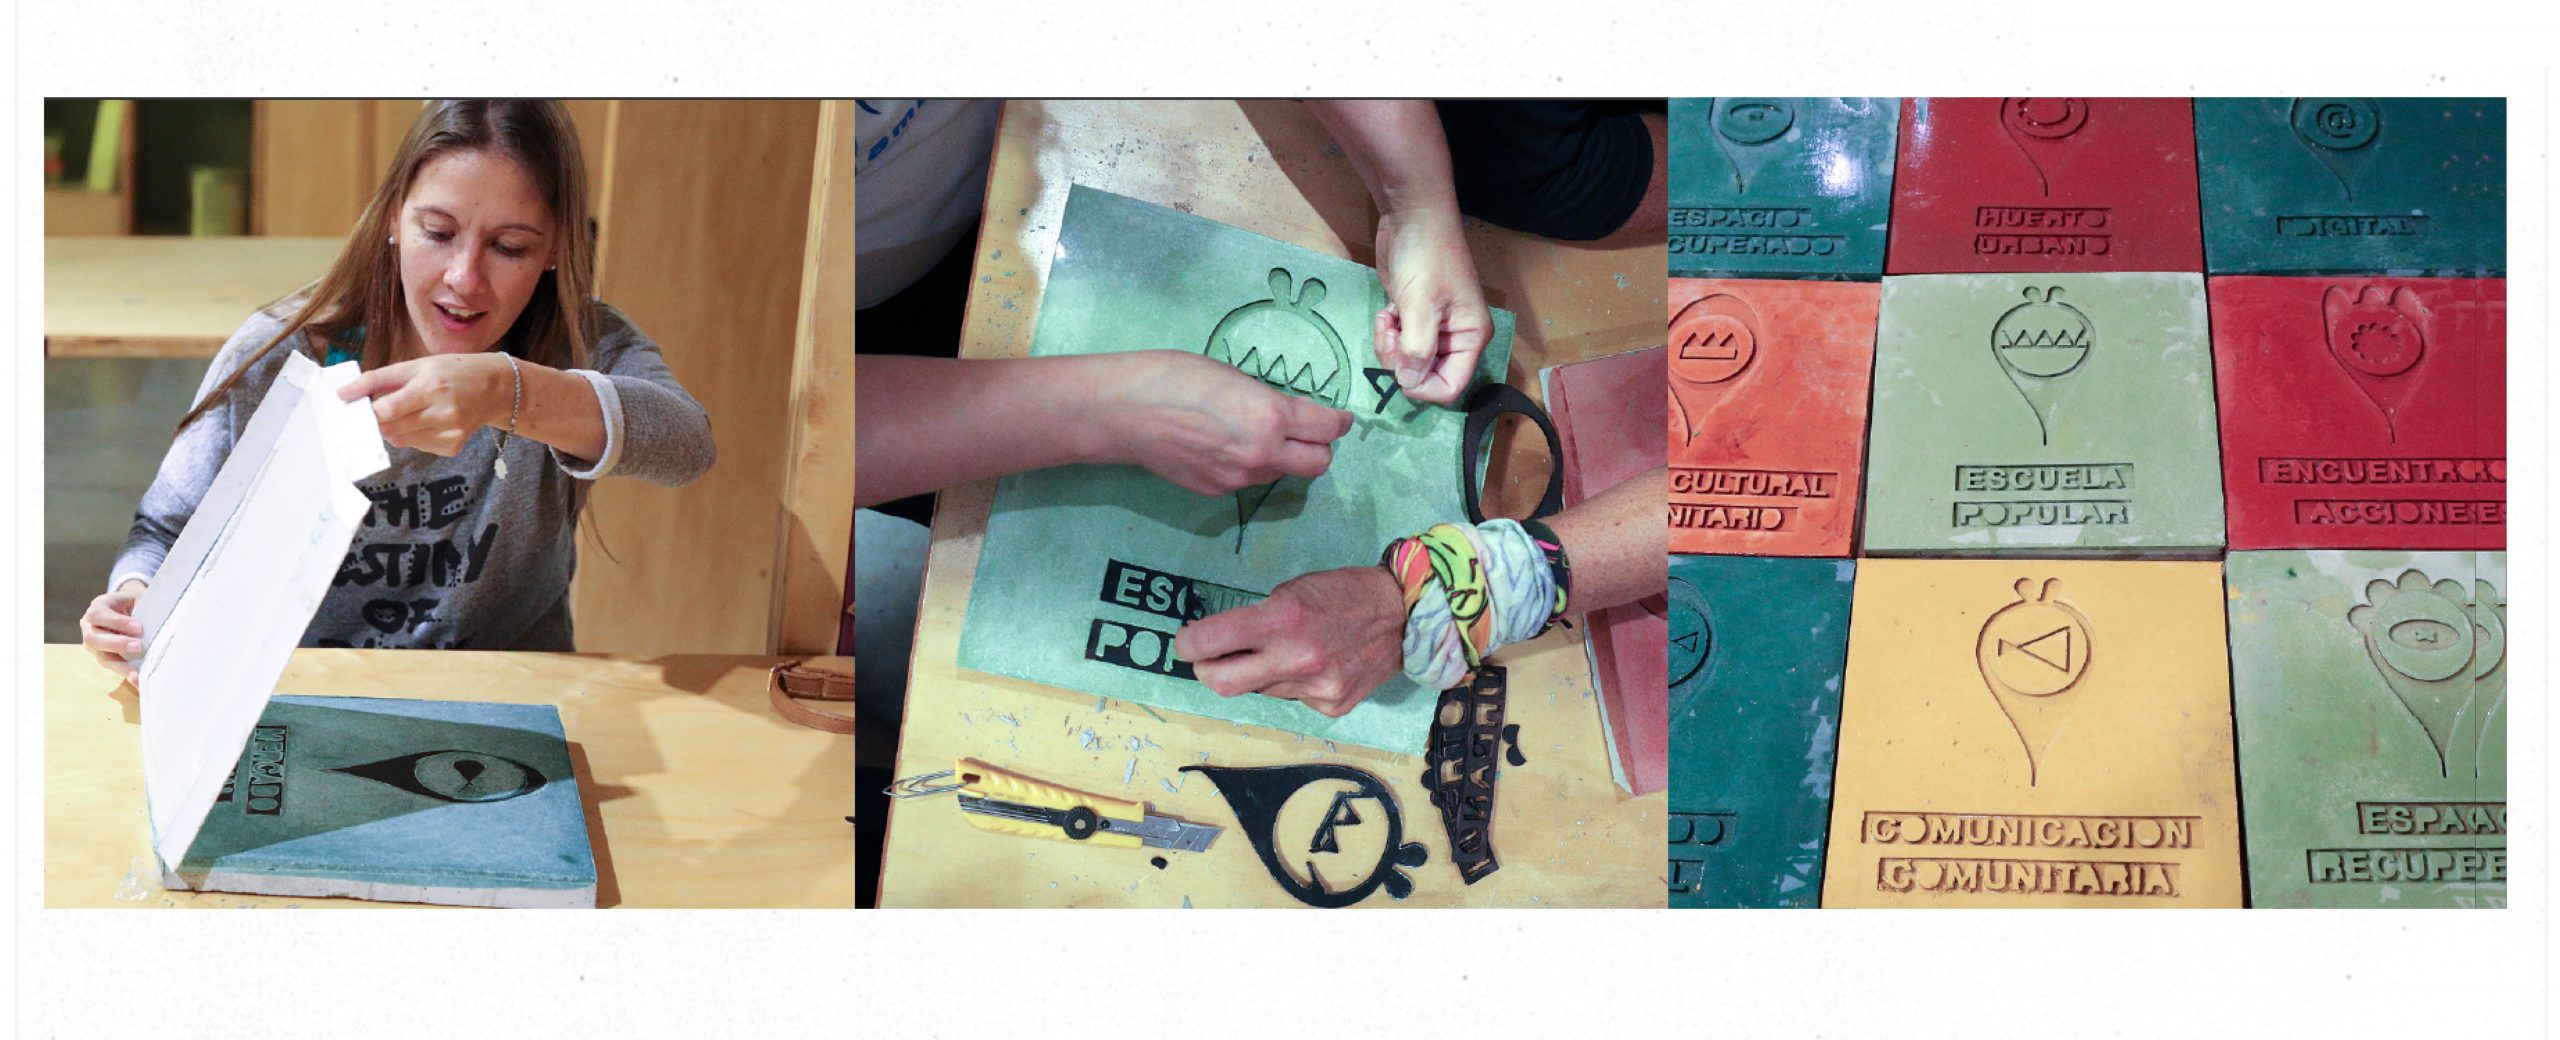
The maps have been combined with other related actions such as the manufacture of urban innovation signage through the collective construction of hydraulic tiles to be installed in spaces and communities in the city – installed on pavements and buildings – as well as the linking of the maps with other digital and face-to-face participation devices, such as participatory budgets and local forums. This creates an ecosystem of physical and digital actions that always combine the same iconography and codes of representation, and which are the starting points for other more ambitious actions such as citizens’ laboratories to prototype urban solutions, participation processes for plans for the use of opportunity spaces, or demonstration projects for the just transition towards resilient and healthy cities.
This article appears in the book The Power of Civic Ecosystems: How community spaces and their networks make our cities more cooperative, fair and resilient.
